15 M4C: Show Your Work
This chapter draws on material from 7. Show Your Work by Catherine D’Ignazio and Lauren Klein, licensed under CC BY 4.0.
Changes to the source material include light editing, adding new material, deleting original material, rearranging material, changing the citation style, adding links, replacing images, changing original authors’ voice to third person, and adding first-person language from current author.
The resulting content is licensed under CC BY 4.0.
15.1 Introduction
Earlier this semester, each of you set up an account with GitHub. As of June 2018, this online code-management platform had over twenty-eight million users worldwide. By allowing users to create web-based repositories of source code (among other forms of content) to which project teams of any size can then contribute, GitHub makes collaborating on a single piece of software or a website or even a book much easier than it has ever been before (this book is hosted in GitHub, as is a book on data science in education written by my friend Josh and his co-authors).
Unfortunately, though, there’s a gender dynamic present to this “much easier.” A 2016 study found that female GitHub users were less likely to have their contributions accepted if they identified themselves in their user profiles as women. The authors do not appear to have considered nonbinary genders, although they do maintain a category for “gender-neutral” usernames that cannot be categorized as either men’s or women’s names (Terrell et al,. 2017). Critics of GitHub’s commitment to inclusivity, or the lack thereof, also point to the company’s internal politics. In 2014, GitHub’s cofounder was forced to resign after allegations of sexual harassment were brought to light (Miller, 2014). More recently, in 2018, Agnes Pak, a former top attorney at GitHub, sued the company for allegedly altering her performance reviews after she complained about her gender and race contributing to a lower compensation package, giving them the grounds to fire her (Baron, 2018). Pak’s suit came shortly after transgender software developer Coraline Ada Ehmke declined a significant severance package in 2017 so that she could talk publicly about her negative experience of working at GitHub (Ehmke, 2017). Clearly, GitHub has several major issues of corporate culture that it must address.
But a corporate culture that is hostile to women does not necessarily preclude other feminist interventions, and GitHub makes one important one: Its platform helps show the work of writing collaborative code. In addition to basic project management tools, like bug tracking and feature requests, the GitHub platform also generates visualizations of each team member’s contributions to a project’s codebase. Area charts, arranged in small multiples, allow viewers to compare the quantity, frequency, and duration of any particular member’s contributions. A line graph reveals patterns in the day of the week when those contributions took place. And a flowchart-like diagram of the relationships between various branches of the project’s code helps to acknowledge any sources for the project that might otherwise go uncredited, as well as any additional projects that might build upon the project’s initial work.
Coding is work, as anyone who’s ever programmed anything knows well. But it’s not always work that is easy to see. The same is true for collecting, analyzing, and visualizing data. We tend to marvel at the scale and complexity of an interactive visualization like the Ship Map, which plots the paths of the global merchant fleet over the course of the 2012 calendar year. By showing every single sea voyage, the Ship Map exposes the networks of waterways that constitute our global product supply chain. However, we are less often exposed to the networks of processes and people that help constitute the visualization itself—from the seventy-five corporate researchers at Clarksons Research UK who assembled and validated the underlying dataset, to the academic research team at University College London institute that developed the data model, to the design team at Kiln that transformed the data model into the visualization that we see. And that is to say nothing of the tens of thousands of commercial ships that served as the source of data in the first place. Visualizations like the Ship Map involve the work of many hands.
Unfortunately, however, when releasing a data product to the public, we tend not to credit the many hands who perform this work. We often cite the source of the dataset, and the names of the people who designed and implemented the code and graphic elements. But we rarely dig deeper to discover who created the data in first place, who collected the data and processed them for use, and who else might have labored to make creations like the Ship Map possible. Admittedly, this information is sometimes hard to find. Likewise, when project teams (or individuals) are already operating at full capacity, or under budgetary strain, this information can—ironically—simply be too much additional work to pursue (see Martin, 2010). Even in cases in which there are both resources and desire, information about the range of the contributors to any particular project sometimes can’t be found at all.
15.2 Invisible Labor
But the various difficulties we encounter when trying to acknowledge this work reflects a larger problem in what information studies scholar Miriam Posner (2018) calls our data supply chain. Like the contents of the ships visualized on the Ship Map, about which we only know sparse details—the map can tell us if a shipping container was loaded onto the boat, but not what the shipping container contains—the invisible labor involved in data work, as Posner argues, is something that corporations have an interest in keeping out of public view.
To put it more simply, it’s not a coincidence that much of the work that goes into designing a data product—visualization, algorithm, model, app—remains invisible and uncredited. In our capitalist society, we tend to value work that we can see. This is the result of a system in which the cultural worth of any particular form of work is directly connected to the price we pay for it; because a service costs money, we recognize its larger value. More often than not, though, the reverse also holds true: We fail to recognize the larger value of the services we get for free.
When, in the early 1970s, the International Feminist Collective launched the Wages for Housework campaign, it was this phenomenon of invisible labor—labor that was unpaid and therefore unvalued—that the group was trying to expose (see Federici, 1975). The precise term they used to describe this work was reproductive labor, which comes from the classical economic distinction between the paid and therefore economically productive labor of the marketplace, and the unpaid and therefore economically unproductive labor of everything else. By reframing this latter category of work as reproductive labor, rather than simply (and inaccurately) unproductive labor, groups like the International Feminist Collective sought to emphasize how the range of tasks that the term encompassed, like cooking and cleaning and child-rearing, were precisely the tasks that enabled those who performed “productive” labor, like office or factory work, to continue to do so.
The Wages for Housework movement began in Italy and migrated to the United States with the help of labor organizer and theorist Silvia Federici. It eventually claimed chapters in several American cities, and did important consciousness-raising work. Still, as prominent feminists like Angela Davis pointed out, while housework might have been unpaid for White women, women of color—especially Black women in the United States—had long been paid, albeit not well, for their housework in other people’s homes: “Because of the added intrusion of racism, vast numbers of Black women have had to do their own housekeeping and other women’s home chores as well” (Davis, 1983).
Here, Davis is making an important point about racialized labor: just as housework is structured along the lines of gender, it is also structured along the lines of race and class. The domestic labor of women of color was and remains underwaged labor, as feminist labor theorists would call it, and its low cost was what permitted (and continues to permit) many White middle- and upper-class women to participate in the more lucrative waged labor market instead.
Since the 1970s, the term invisible labor has come to encompass the various forms of labor, unwaged, underwaged, and even waged, that are rendered invisible because they take place inside of the home, because they take place out of sight, or because they lack physical form altogether. Visit this Internet Archive capture of the now-defunct WagesforFacebook.com and you’ll find a version of the Wages for Housework argument updated for a new form of invisible work.
This invisible labor can be found all over the web, as digital labor theorists such as Tiziana Terranova (2000) have helped us to understand. “They call it sharing. We call it stealing,” is one of the statements that scrolls down the screen in large black type. The word it refers to work that most of us perform every day, in the form of our Facebook likes, Instagram posts, and Twitter tweets. The point made by Laurel Ptak, the artist behind Wages for Facebook—a point also made by Terranova—is that the invisible unpaid labor of our likes and tweets is precisely what enables the Facebooks and Twitters of the world to profit and thrive.
15.3 The Invisible Labor of Data Science
The world of data science is able to profit and thrive because of unpaid invisible labor as well. Perhaps my “favorite” example of this is from the very geeky xkcd webcomic, which once ran the following comic:
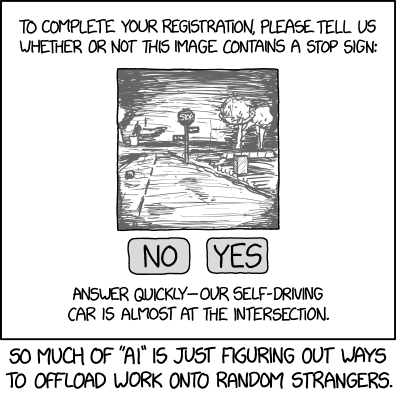
Self Driving by Randall Munroe is licensed under CC BY-NC 2.5
Have you ever wondered why these distinctive CAPTCHA tests require you to do image identification? Or why they’re so often related to roads, signs, and vehicles? The idea behind a CAPTCHA test is to require a human to do a task that an automated system can’t do. That’s a pretty good way of telling a human from an automated system! Ironically, though, those aggregated human tasks are often used to train automated systems to work better. Google (who owns the popular reCAPTCHA system) uses CAPTCHA tests to train systems for automated image recognition—which has obvious benefits if you’re developing self-driving cars.
Ever since reading this comic, I’ve gotten angry whenever I complete one of these. Not only does such-and-such a website believe that I’m a robot, but the only way to prove my humanity is to do free work for Google. All I get out of it is to continue to the website I want, but Google is in a position to make gobs of money based on my (and millions of others’) free labor.
Other crowdsourcing projects (helping Netflix with its recommendation algorithm, helping a newspaper go through interesting documents, etc.) are framed as acts of benevolence (and, in the case of Netflix, an opportunity to win a million-dollar prize). People should want to contribute to these projects, their proponents claimed, since their labor would further the public good. It’s also worth pointing out, though, that when he coined the term in the mid-2000s, Jeff Howe argued that crowdsourcing was a powerful way to tap networked knowledge for corporate use. “The labor isn’t always free, but it costs a lot less than paying traditional employees,” he wrote (Howe, 2006).
Plus, Ashe Dryden, the software developer and diversity consultant, points out that people can only help crowdsource if they have the inclination and the time (Dryden, 2014). Think back to that study of GitHub. If you were a woman and you knew your contributions to a programming project were less likely to be accepted than if you were a man, would that motivate you to contribute the project?
Or, for another example, consider Wikipedia. Although the exact gender demographics of Wikipedia contributors are unknown, numerous surveys have indicated that those who contribute content to the crowdsourced encyclopedia are between 84 percent and 91.5 percent men (Hills & Shaw, 2013; Wikimedia, n.d.). Why? It could be that there, too, edits are less likely to be accepted if they come from women editors (Whose Knowledge, n.d.). It could also be attributed to Wikipedia’s exclusionary editing culture and technological infrastructure, as science and technology studies (STS) scholars Heather Ford and Judy Wajcman (2017) have argued. And there is also reason to go back to the housework argument. Dryden cites a 2011 study showing that women in twenty-nine countries spend more than twice as much time on household tasks than men do, even when controlling for women who hold full-time jobs (Miranda, 2011). Like the other estimates of gender cited here, the study did not consider nonbinary genders or same-sex (or other non-heterotypical) households. But even as a rough estimate, it seems that women simply don’t have as much time.
15.4 Time and Money
In capitalist societies, it’s very often the case that time is money. But it’s also important to remember to ask whose time is being spent and whose money is being saved. The premise behind Amazon’s Mechanical Turk—or MTurk, as the crowdsourcing platform is more commonly known—is that data scientists want to save their own time and their own bottom line. The MTurk website touts its access to a global marketplace of “on-demand Workers,” who are advertised as being more “scalable and cost-effective” than the “time consuming [and] expensive” process of hiring actual employees (Amazon Mechanical Turk, n.d.)
Thus, MTurk is a marketplace for crowdsourced human labor—individuals and businesses that have “human intelligence tasks” can set up jobs for online workers to complete. Often repetitive, like describing images or taking surveys, the jobs are compensated in tiny financial increments that don’t add up to a minimum hourly wage—not to mention a living wage. However, a recent study by the Pew Research Center showed that 51 percent of US-based Turkers, as they are known, hold college degrees, and 88 percent are below the age of fifty, among other metrics that would otherwise rank them among the most desired demographic for salaried employees (Hitlin, 2016).
This form of underwaged work is also increasingly outsourced from the United States to countries with fewer (or worse) labor laws and fewer (or worse) opportunities for economic advancement. A 2010 University of California, Irvine study measured a 20 percent drop in the number of US-based Turkers over the eighteen months that it monitored (Ross et al., 2010). This trend has continued, the real-time MTurk tracker shows. (The gender split, interestingly, has evened out over time.)
Even at resource-rich companies like Amazon and Google, the work of data entry is profoundly undervalued in proportion to the knowledge it helps to create. Andrew Norman Wilson’s 2011 documentary Workers Leaving the Googleplex exposes how the workers tasked with scanning the books for the Google Books database are hired as a separate but unequal class of employee, with ID cards that restrict their access to most of the Google campus and that prevent them from enjoying the company’s famed employee perks.
15.5 Crediting Data Work
The emphasis on giving formal credit for a broad range of work derives from feminist practices of citation. Feminist theorist Sara Ahmed describes this practice as a way of resisting how certain types of people—usually cis and White and male—“take up spaces by screening out others” (Ahmed, 2013). When those other people are screened out, they become invisible, and their contributions go unrecognized. The screening techniques (as Ahmed terms them) that lead to their erasure are not always intentional, but they are, unfortunately, self-perpetuating. Ahmed gives the example of sinking into a leather armchair that is comfortable because it’s molded to the shape of your body over time. You probably wouldn’t notice how the chair would be uncomfortable for those who haven’t spent time sitting in it—those with different bodies or with different demands on their time. Which is why those of us who occupy those comfortable leather seats—or, more likely in the design world, molded plastic Eames chairs—must remain vigilant in reminding ourselves of the additional forms of labor, and the additional people, that our own data work rests upon.
This gets complicated quickly even on the scale of a single data science project. The names of all the people and the work they perform are not always easy to locate—if they can be located at all. But taking steps to document all the people who work on a particular project at the time that it is taking place can help to ensure that a record of that work remains after the project has been completed. In fact, this is among the four core principles that comprise the Collaborators’ Bill of Rights, a document developed by an interdisciplinary team of librarians, staff technologists, scholars, and postdoctoral fellows in 2011 in response to the proliferation of types of positions, at widely divergent ranks, that were being asked to contribute to data-based (and other digital) projects (“Collaborators’ Bill of Rights”, 2011; see also Di Pressi et al., 2018).
When designing data products from a feminist perspective, we must similarly aspire to show the work involved in the entire lifecycle of the project. This remains true even as it can be difficult to name each individual involved or when the work may be collective in nature and not able to be attributed to a single source. In these cases, we might take inspiration from the Next System Project, a research group aimed at documenting and visualizing alternative economic systems (Gibson-Graham & the Community Economies Collective, 2017). In one report, the group compiled information on the diversity of community economies operating in locations as far-ranging as Negros Island, in the Philippines; Québec province, in Canada; and the state of Kerala, in India. The report employs the visual metaphor of an iceberg, in which wage labor is positioned at the tip of the iceberg, floating above the water, while dozens of other forms of labor—informal lending, consumer cooperatives, and work within families, among others—are positioned below the water, providing essential economic ballast but remaining out of sight.
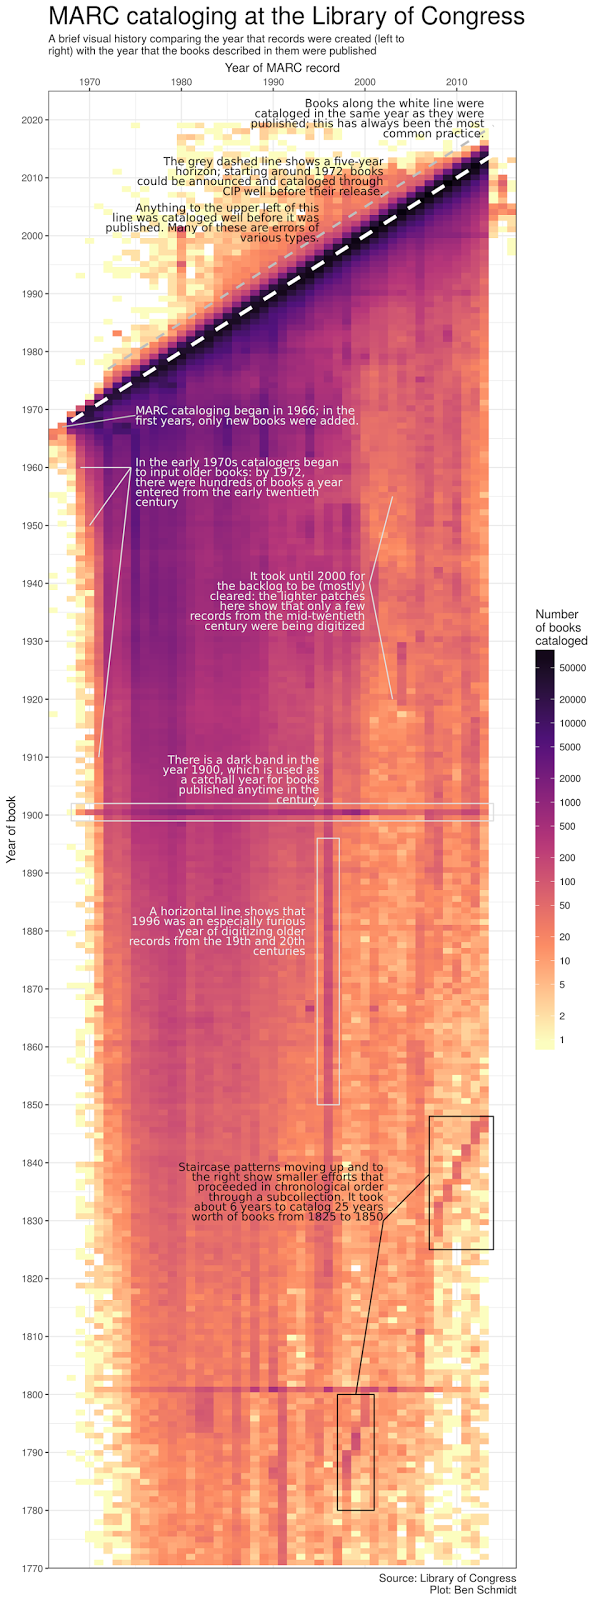
But in more instances than you might think, the labor associated with data work can be surfaced through the data themselves. For instance, historian Benjamin Schmidt (2017), whose research centers on the role of government agencies in shaping public knowledge, decided to visualize the metadata associated with the digital catalog of the US Library of Congress, the largest library in the world. Schmidt’s initial goal was to understand the collection and the classification system that structured the catalog. But in the process of visualizing the catalog records, he discovered something else: a record of the labor of the cataloguers themselves. When he plotted the year that each book’s record was created against the year that the book was published (you can see the plot here), he saw some unusual patterns in the image: shaded vertical lines, step-like structures, and dark vertical bands that didn’t match up with what one might otherwise assume would be a basic two-step process of (1) acquire a book and (2) enter it in.
The shaded vertical lines, Schmidt soon realized, showed the point at which the cataloguers began to turn back to the books that had been published before the library went digital, filling in the online catalogue with older books. The step-like patterns indicated the periods of time, later in the process, when the cataloguers returned to specific subcollections of the library, entering in the data for the entire set of books in a short period of time. And the horizontal lines? Well, given that they appear only in the years 1800 and 1900, Schmidt inferred that they indicated missing publication information, as best practices for library cataloguing dictate that the first year of the century be entered when the exact publication date is unknown.
With an emphasis on showing the work, these visual artifacts should also prompt us to consider just how much physical work was involved in converting the library’s paper records to digital form. The darker areas of the chart don’t just indicate a larger number of books entered into the catalog, after all. They also indicate the people who typed them all in. (Schmidt estimates the total number of records at ten million and growing.) Similarly, the step-like formations don’t just indicate a higher volume of data entry. They indicate strategic decisions made by library staff to return to specific parts of the collection and reflect those staff members’ prior knowledge of the gaps that needed to be filled—in other words, their intellectual labor as well. Schmidt’s visualization helps to show how the dataset always points back to the data setting—to use Yanni Loukissas’s helpful phrase—as well as to the people who labored in that setting to produce the data that we see.
15.6 Crediting Emotional Labor and Care Work
In addition to the invisible labor of data work, there is also labor that remains hidden because we are not trained to think of it as labor at all. This is what is known as emotional labor, and it’s another form of work that feminist theory has helped to bring to light. As described by feminist sociologist Arlie Hochschild (2012), emotional labor describes the work involved in managing one’s feelings, or someone else’s, in response to the demands of society or a particular job. Hochschild coined the term in the late 1970s to describe the labor required of service industry workers, such as flight attendants, who are required to manage their own fear while also calming passengers during adverse flight conditions, and generally work to ensure that flight passengers feel cared for and content. In the decades that followed, the notion of emotional labor was supplemented by a related concept, affective labor, so that the work of projecting a feeling (the definition of emotion) could be distinguished from the work of experiencing the feeling itself (the definition of affect).
We can see both emotional and affective labor at work all across the technology industry today. Consider, for instance, how call center workers and other technical support specialists must exert a combination of affective and emotional labor, as well as technical expertise, to absorb the rage of irate customers (affective labor), reflect back their sympathy (emotional labor), and then help them with—for instance—the configuration of their wireless router (technical expertise; see Brophy & Woodcock, 2019). In the workplace, we might also consider the affective labor required by women and minoritized groups, in all situations, who must take steps to disprove (or simply ignore) the sexist, racist, or otherist assumptions they face—about their technical ability or about anything else. And they must do so while also performing the emotional labor that ensures that they do not threaten those who hold those assumptions, who often also hold positions of power over them. Are there ways to visualize these forms of labor, giving visual presence—and therefore acknowledgement and credit—to these outlays of work?
15.7 Show Your Work
Data work is part of a larger ecology of knowledge, one that must be both sustainable and socially just. Like the ship paths visualized on the Ship Map or the source code stored on GitHub, the network of people who contribute to data projects is vast and complex. Showing this work is an essential component of feminist data science. An emphasis on labor opens the door to the interdisciplinary area of data production studies: taking a data visualization, model, or product and tracing it back to its material conditions and contexts, as well as to the quality and character of the work and the people required to make it. This kind of careful excavation can be undertaken in academic, journalistic, or general contexts, in all cases helping to make more clearly visible—and therefore to value—the work that data science rests upon.
We can also look to the data themselves in order to honor the range of forms of invisible labor involved in data science. Who is credited on each project? Whose work has been “screened out”? While one strategy is to show the work behind making data products themselves, another strategy for honoring work of all forms is to use data science to show the work of people (mostly women) who labor in other sectors of the economy, those that involve emotional labor, domestic work, and care work. Designing in solidarity with domestic workers can begin to challenge the structural inequalities that relegate their work to the margins in the first place.
This point brings us back to ideas about power that we will read about throughout this semester. Power imbalances are everywhere in data science: in our datasets, in our data products, and in the environments that enable our data work. Showing the work is crucial to ensure that undervalued and invisible labor receives the credit it deserves, as well as to understand the true cost and planetary consequences of data work.
15.8 References
Ahmed, S. (2013, September 11). Making feminist points. Feministkilljoys [blog]. https://feministkilljoys.com/2013/09/11/making-feminist-points/
Amazon Mechanical Turk. (n.d.). https://www.mturk.com/ (accessed April 22, 2019).
Baron, E. (2018, October 1) GitHub paid executive less because she’s Asian and female, fired her for complaining: Lawsuit. Mercury News. https://www.mercurynews.com/2018/10/01/github-paid-executive-less-because-shes-asian-and-female-fired-her-for-complaining-lawsuit/
Brophy, E., & Woodcock, J. (2019, February 14). The call centre seen from below: Issue 4.3 editorial. Notes from Below. https://notesfrombelow.org/article/call-centre-seen-below-issue-43-editorial
“Collaborators’ Bill of Rights.” (2011). In Off the tracks: Laying new lines for digital humanities scholars. MediaCommons.
Davis, A. (1983). Women, race, & class. Penguin Random House.
Di Pressi, H., Gorman, S., Posner, M., Sasayma, R., & Schmitt (with contributions from R. Crooks, M. Driscoll, A. Earhart, S. Keralis, T. Naiman, & T. Presner). (2018, June 8). A student collaborators’ bill of rights. https://humtech.ucla.edu/news/a-student-collaborators-bill-of-rights/
Dryden, A. (2014, April 29). Programming diversity. Talk at Mix-IT, Lyon, France. https://www.ashedryden.com/mixit-programming-diversity
Ehmke, C. A. (2017, July 5). Antisocial coding: My year at GitHub. Coraline Ada Ehmke [blog]. https://where.coraline.codes/blog/my-year-at-github/
Federici, S. (1975). Wages against housework. Power of Women Collective and Falling Water Press.
Ford, H., & Wajcman, J. (2017). “Anyone can edit”, not everyone does: Wikipedia’s infrastructure and the gender gap. Social Studies of Science, 47(4), 511-527.
Gibson-Graham, J. K., & the Community Economies Collective. (2017, February 27). Cultivating Community Economies. Next System Project. https://thenextsystem.org/cultivating-community-economies
Hill, B. M., & Shaw, A. (2013). The Wikipedia gender gap revisited: Characterizing survey response bias with propensity score estimation. PLOS One, 8(6), 1-5.
Hitlin, P. (2016, July 11). Research in the crowdsourcing age, a case study. Pew Research Center: Internet & Technology. https://www.pewresearch.org/internet/2016/07/11/research-in-the-crowdsourcing-age-a-case-study/
Hochschild, A. R. (2012). The managed heart: Commercialization of human feeling (3rd ed.). University of California Press.
Howe, J. (2006, January 6). The rise of crowdsourcing. WIRED. https://www.wired.com/2006/06/crowds/
Martin, J. L. (2010). Life’s a beach but you’re an ant, and other unwelcome news for the sociology of culture. Poetics, 38(2), 229-244.
Miller, C. C. (2014, April 21). Github founder resigns after investigation. New York Times. https://archive.nytimes.com/bits.blogs.nytimes.com/2014/04/21/github-founder-resigns-after-investigation/
Miranda, V. (2011). Cooking, caring and volunteering: Unpaid work around the world. OECD Social, Employment and Migration Papers, 116. https://www.oecd.org/berlin/47258230.pdf
Posner, M. (2018, April). See no evil. Logic Magazine. https://logicmag.io/scale/see-no-evil/
Ross, J., Irani, L., Silberman, M. S., Zaldivar, A., & Tomlinson, B. Who are the crowdworkers? Shifting demographics in Mechanical Turk. In CHI 2010: Imagine All the People (pp. 2863-2872).
Schmidt, B. M. (2017, May 16). A brief visual history of MARC cataloging at the Library of Congress. Sapping Attention [blog]. http://sappingattention.blogspot.com/2017/05/a-brief-visual-history-of-marc.html
Terranova, T. (2000). Free labor: Producing culture for the digital economy. Social Text, 18(2), 33-58.
Terrell, J., Kofink, A., Middleton, J., Rainear, C., Murphy-Hill, E., Parnin, C., & Stallings, J. (2017). Gender differences and bias in open source: Pull request acceptance of women versus men. PeerJ Computer Science, 3(e111).
Whose Knowledge. (n.d.). #VisibleWikiWomen 2019. https://whoseknowledge.org/initiatives/visiblewikiwomen-2019/
Wikimedia. (n.d.). Editor Survey 2011/Executive Summary. https://meta.wikimedia.org/wiki/Editor_Survey_2011/Executive_Summary